As a patient advocate, you have likely heard or seen the phrases “statistically significant” and “p-value” many times. However, these terms can be easily misunderstood. This article aims to demystify statistical significance and the p-value.
Null and Alternative Hypotheses
To understand statistical significance, we first need to discuss null and alternative hypotheses. In statistics, a null hypothesis (sometimes denoted as H0) is the assumption that there is no significant difference, effect, or relationship between variables. In other words, it suggests that any observed differences or effects in the data are due simply due to chance. In a clinical trial evaluating the effectiveness of a new drug, the null hypothesis might state that the new drug does not change anything. The alternative hypothesis (sometimes denoted as Ha or H1) is the assumption that there is a significant difference, effect, or relationship between variables. In the same clinical trial, the alternative hypothesis might state that the new drug elicits a response that is significantly different than the placebo or standard of care does. It is important to note that the alternative hypothesis can be one-sided (e.g., Drug A will reduce cholesterol levels; Drug B will increase cholesterol levels) or two-sided (e.g., Drug C will have an impact on cholesterol levels – either making levels higher or lower). The nature of the alternative hypothesis informs the experiment, outcomes measures, and what is considered ‘statistically significant’.
P Values
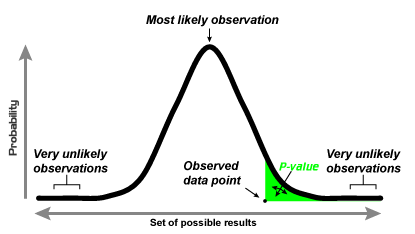
At its core, p-values represent the probability of a null hypothesis being true. When a p-value is small, it suggests that the null hypothesis has a small chance of being true. In other words, a small p value would indicate that there is a large difference observed and that difference is NOT due to chance. And yes, it is a bit confusing but once you can grasp the double-negative nature of the argument, it will start to make sense. For example, if the null hypothesis is that telling a dog ‘no’ will not change how many times a dog barks when the doorbell rings, then the simple experiment would be five dog owners tell their dog ‘no’ when their dog barks when the doorbell rings and five other dog owners will continue their normal behaviour. After two weeks, the five ‘no’ dog owners saw a 40% reduction in barking behaviour while the five in the control group saw a 3% reduction in barking behaviour. The difference of 37% is quite a bit and is likely NOT due to chance. As such, the p-value would likely be quite low (e.g., p = 0.017), assuming the study is well designed.

The p value is calculated and compared against a predetermined threshold of significance; in clinical trials, this is often 0.05 or 0.01, denoted as p < 0.05 or p < 0.01, respectively. Notice that this number is not zero – that is because there is always some possibility that the findings are due to random chance, even if the effect of the intervention seems too extreme for the null hypothesis to be true. For a finding to be statistically significant, the p value must be less than the significance level; this means if p = 0.051, the finding is not statistically significant. Additionally, if a hypothesis test is two-sided, the significance level is divided in half (e.g., p < 0.025, p < 0.005). Ultimately, p-values provide a standardized measure of the strength of evidence for accepting or rejecting a null hypothesis, and help researchers avoid Type I errors or false-positives, in which the alternative hypothesis is incorrectly accepted when the null hypothesis is actually true.
Below provides a visual explanation of p-values:

It is important to keep in mind that statistical significance, as determined by p values, does not necessarily equate to practical significance or importance. A result may be statistically significant but not clinically or practically meaningful. This is one reason why other measures like confidence intervals, effect sizes, and qualitative data are used in conjunction with p-values. To illustrate, there is a possibility that the dogs in our doorbell study example had other confounded factors that made the one group more obedient than the other (Younger age? Different breeds? Extra affection when they did not bark? More frequent doorbell rings during the two-week study? Etc).
Look for future articles where we explore some of those cofounding factors in more detail, as well as other popular terms used in statistics and clinical research, such as ‘qualitative vs quantitative analysis’, ‘the placebo effect’, and ‘primary outcome measures.’

